Living in Bolingbrook, IL
A modern suburban hub with incredible amenities and strategic access
Bolingbrook is one of Illinois’ fastest-growing villages, known for its award-winning parks, massive retail centers, and a location that sits perfectly at the junction of I-55 and I-355. If you’re searching things like “Is Bolingbrook a good place to live?” “Bolingbrook IL schools,” “Bolingbrook commute,” or “Bolingbrook vs Naperville,” this page provides the real-world perspective on why so many buyers are choosing this Will County standout.
What makes Bolingbrook unique is its "new-suburb" energy. It transitioned from a small settlement to a major suburban destination in a few short decades, resulting in organized subdivisions, modern infrastructure, and a massive variety of housing styles from starter townhomes to luxury golf-course estates.
What it feels like to live in Bolingbrook
Bolingbrook feels active, convenient, and surprisingly green for a town with so much retail power.
-
High convenience (everything you need is within a 10-minute drive)
-
A true "melting pot" feel with a global community
-
Modern recreation facilities that rival private clubs
It is a place where you can spend the morning on a championship golf course and the afternoon at an open-air mall, all without leaving your zip code. It’s built for people who value their time and like having amenities close at hand.
A day in the life in Bolingbrook
Life here is streamlined. For professionals, the proximity to major interstates makes the morning rush more manageable. You aren't just stuck with one way in or out of town.
Weekends are centered around the "Big Three":
-
The Promenade for shopping, dining, and outdoor events
-
Pelican Harbor for year-round indoor/outdoor swimming
-
Hidden Oaks or the local preserves for getting back into nature
It’s a "get out and do things" kind of town. People are generally out and about, whether at the library, the parks, or the community centers.
The Promenade & Retail Life
Bolingbrook doesn't have a 100-year-old "Main Street," but it has The Promenade—a beautiful open-air retail center that acts as the village’s social heart.
Why locals love the retail corridors here:
-
The Promenade Bolingbrook – High-end shops and seasonal festivals
-
Massive variety of international dining options
-
Home to IKEA and Bass Pro Shops, drawing people from all over
-
Star Cinema Grill and other entertainment spots
If you enjoy having a "destination" feel within five minutes of your driveway, Bolingbrook delivers that better than almost any other western suburb.
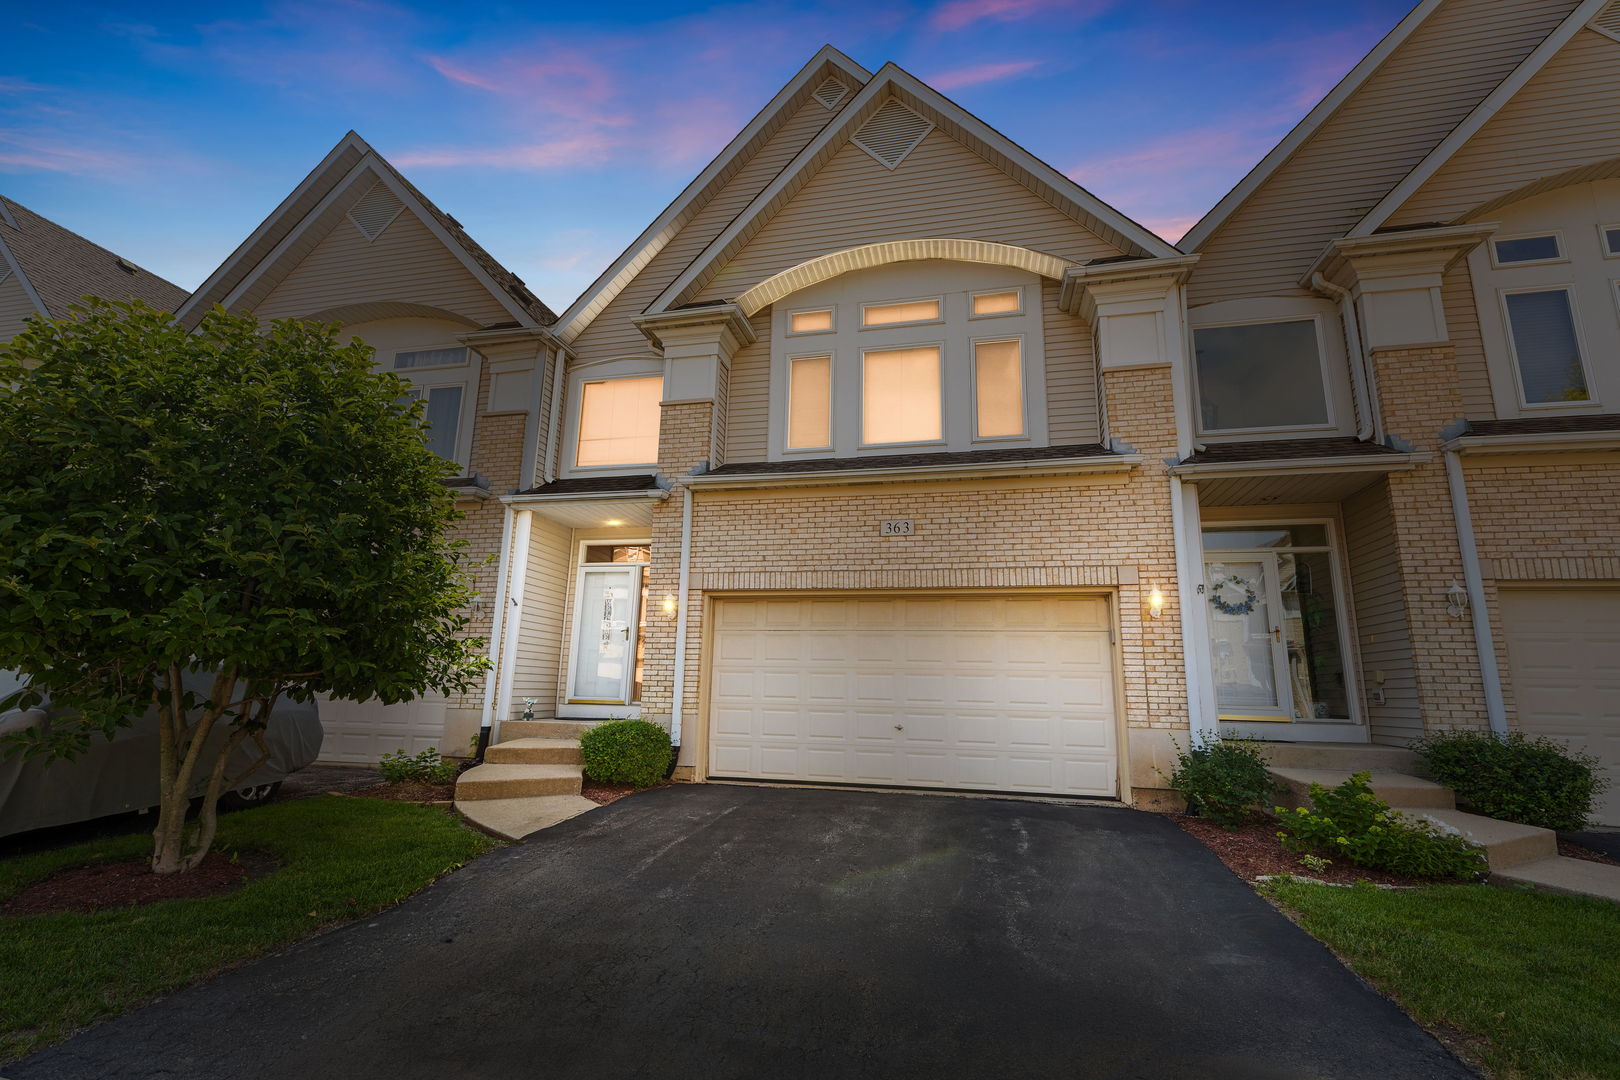
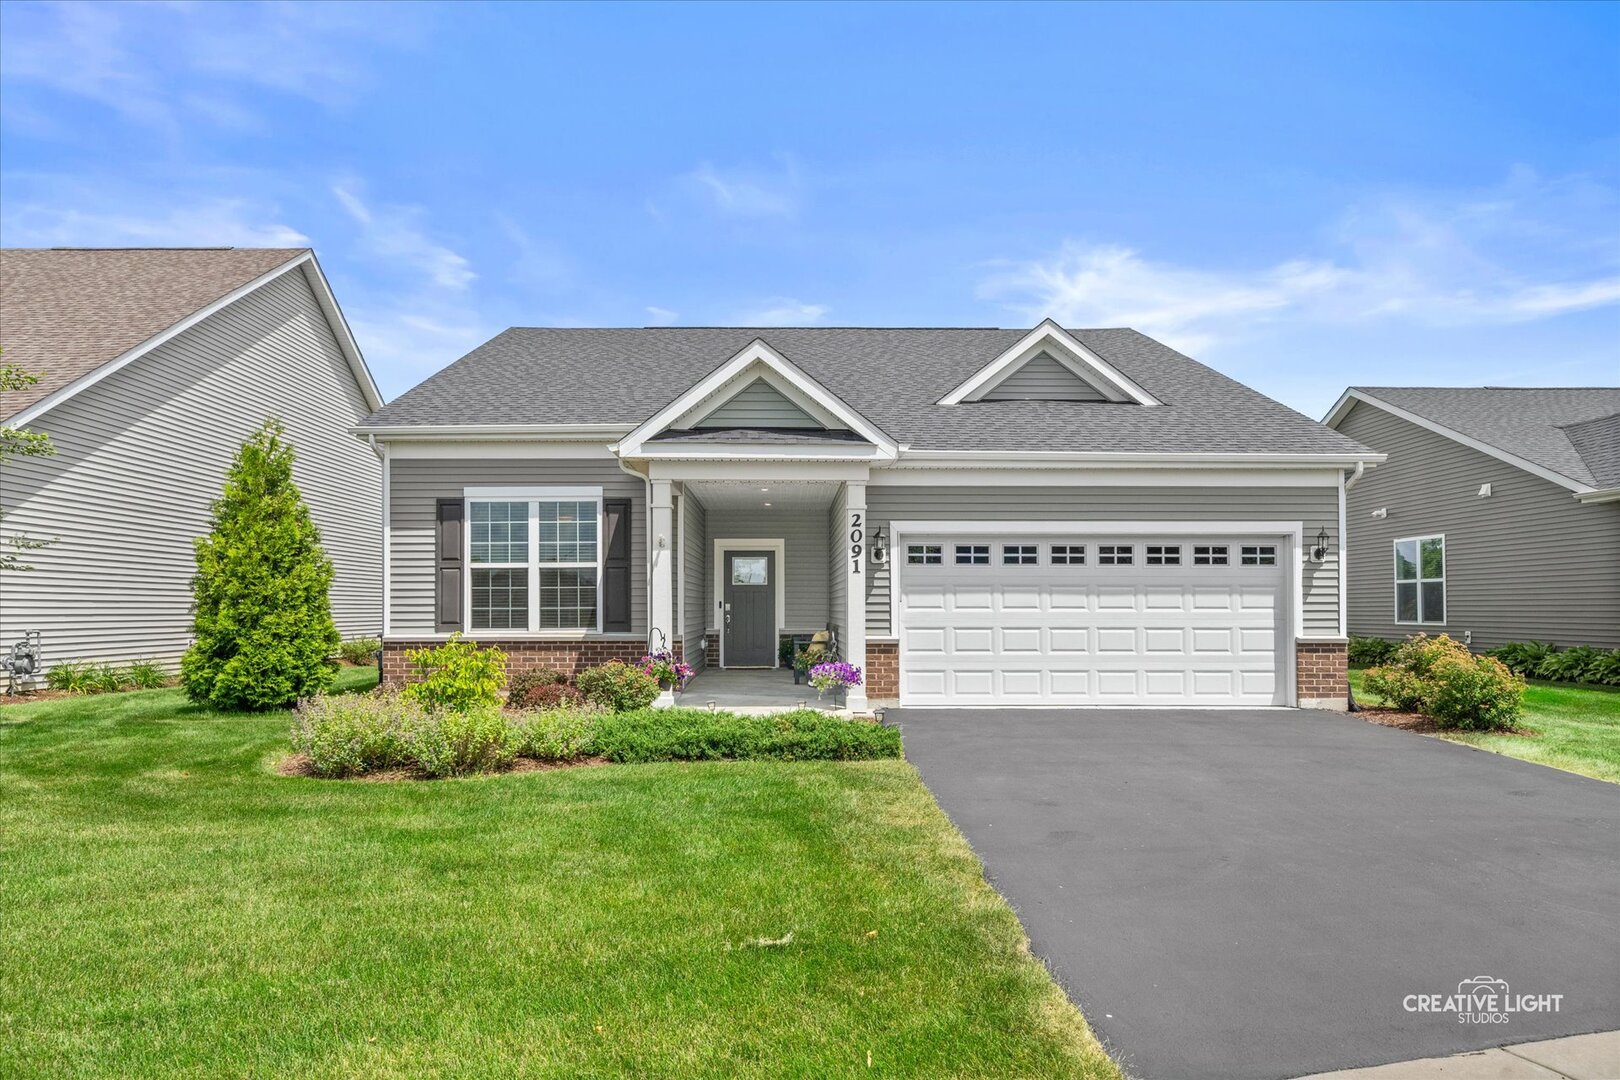
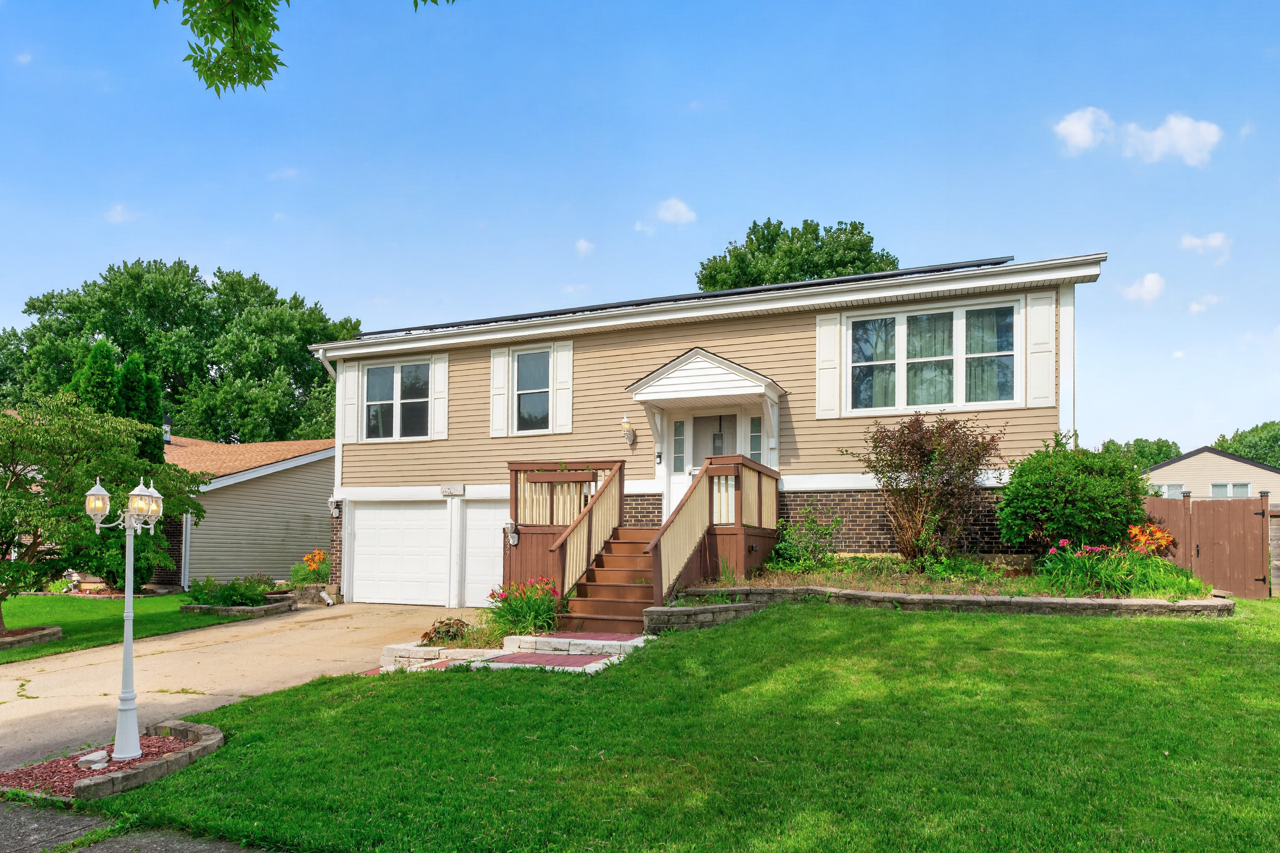
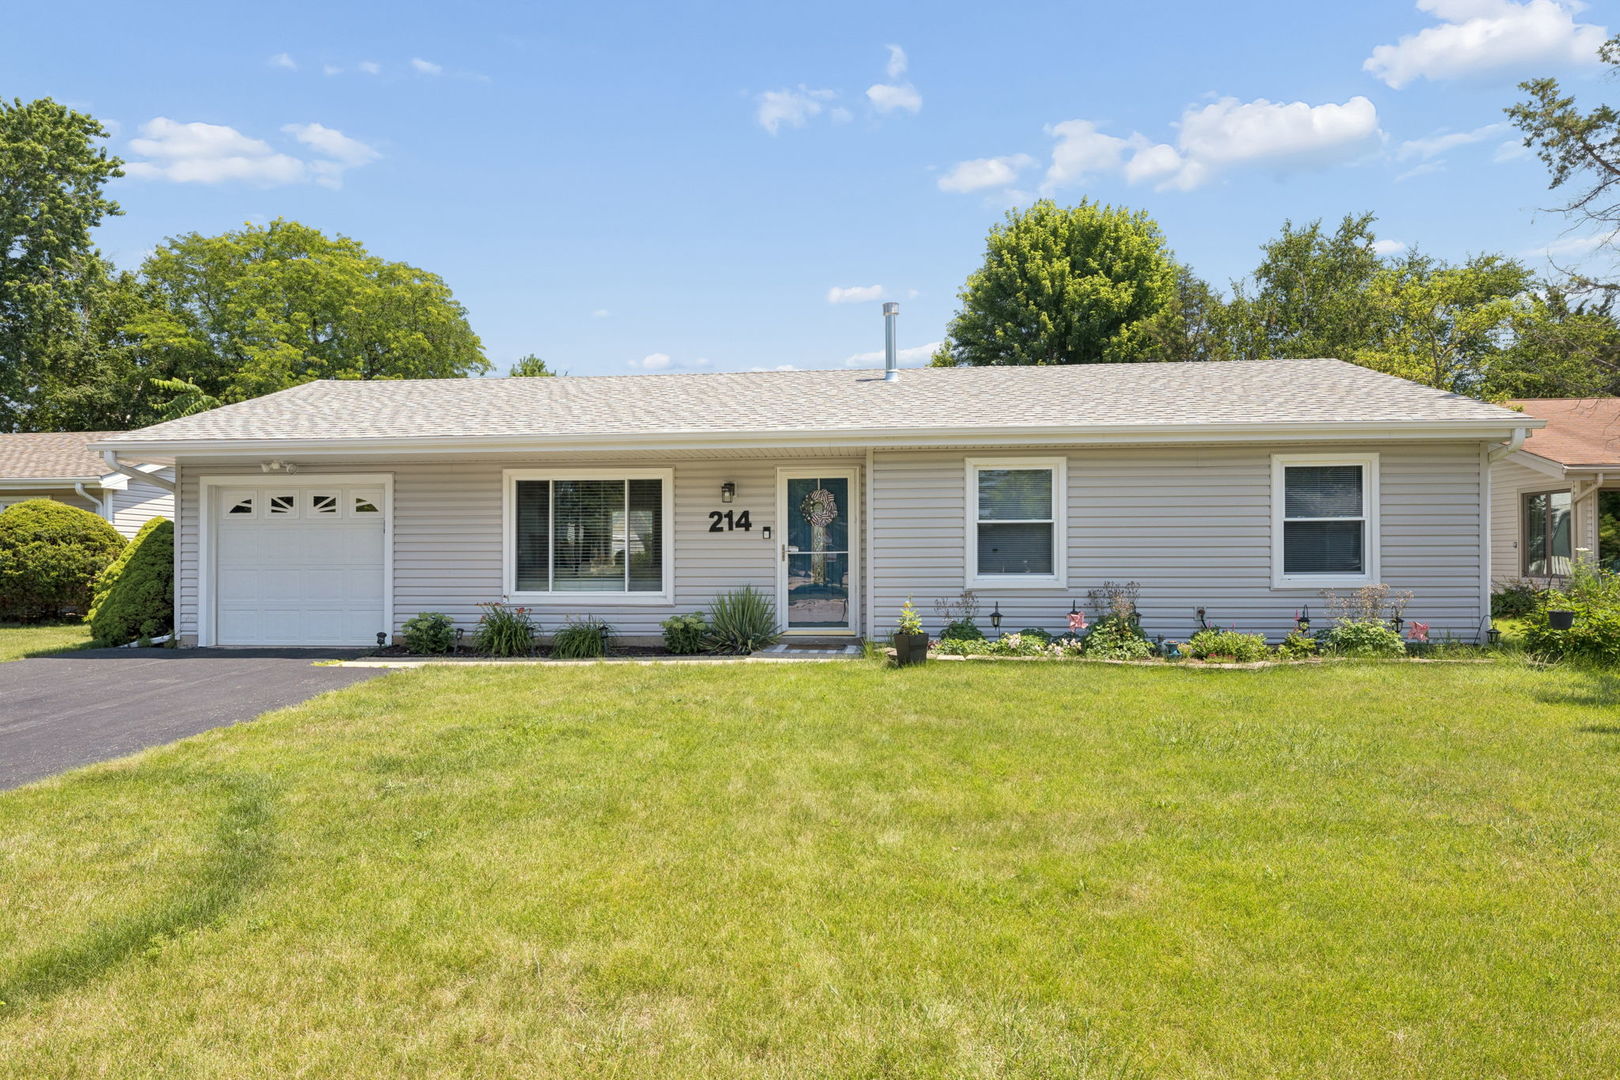
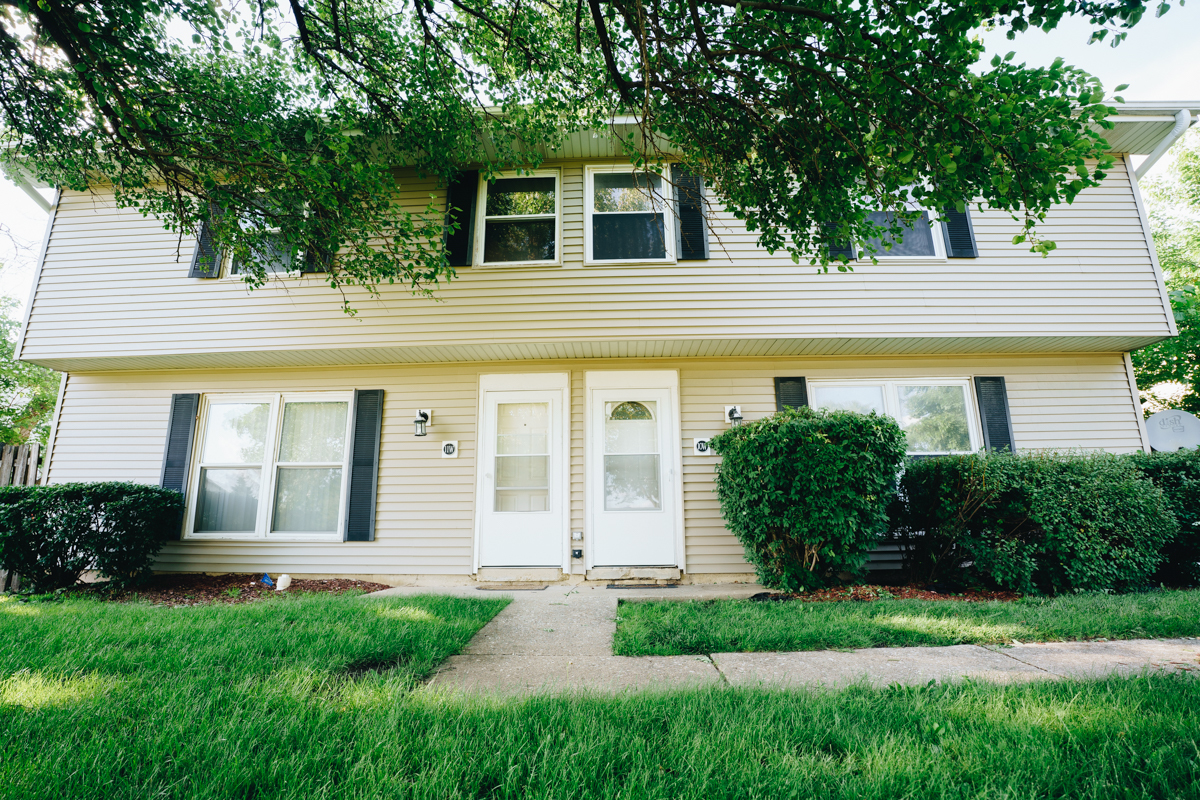
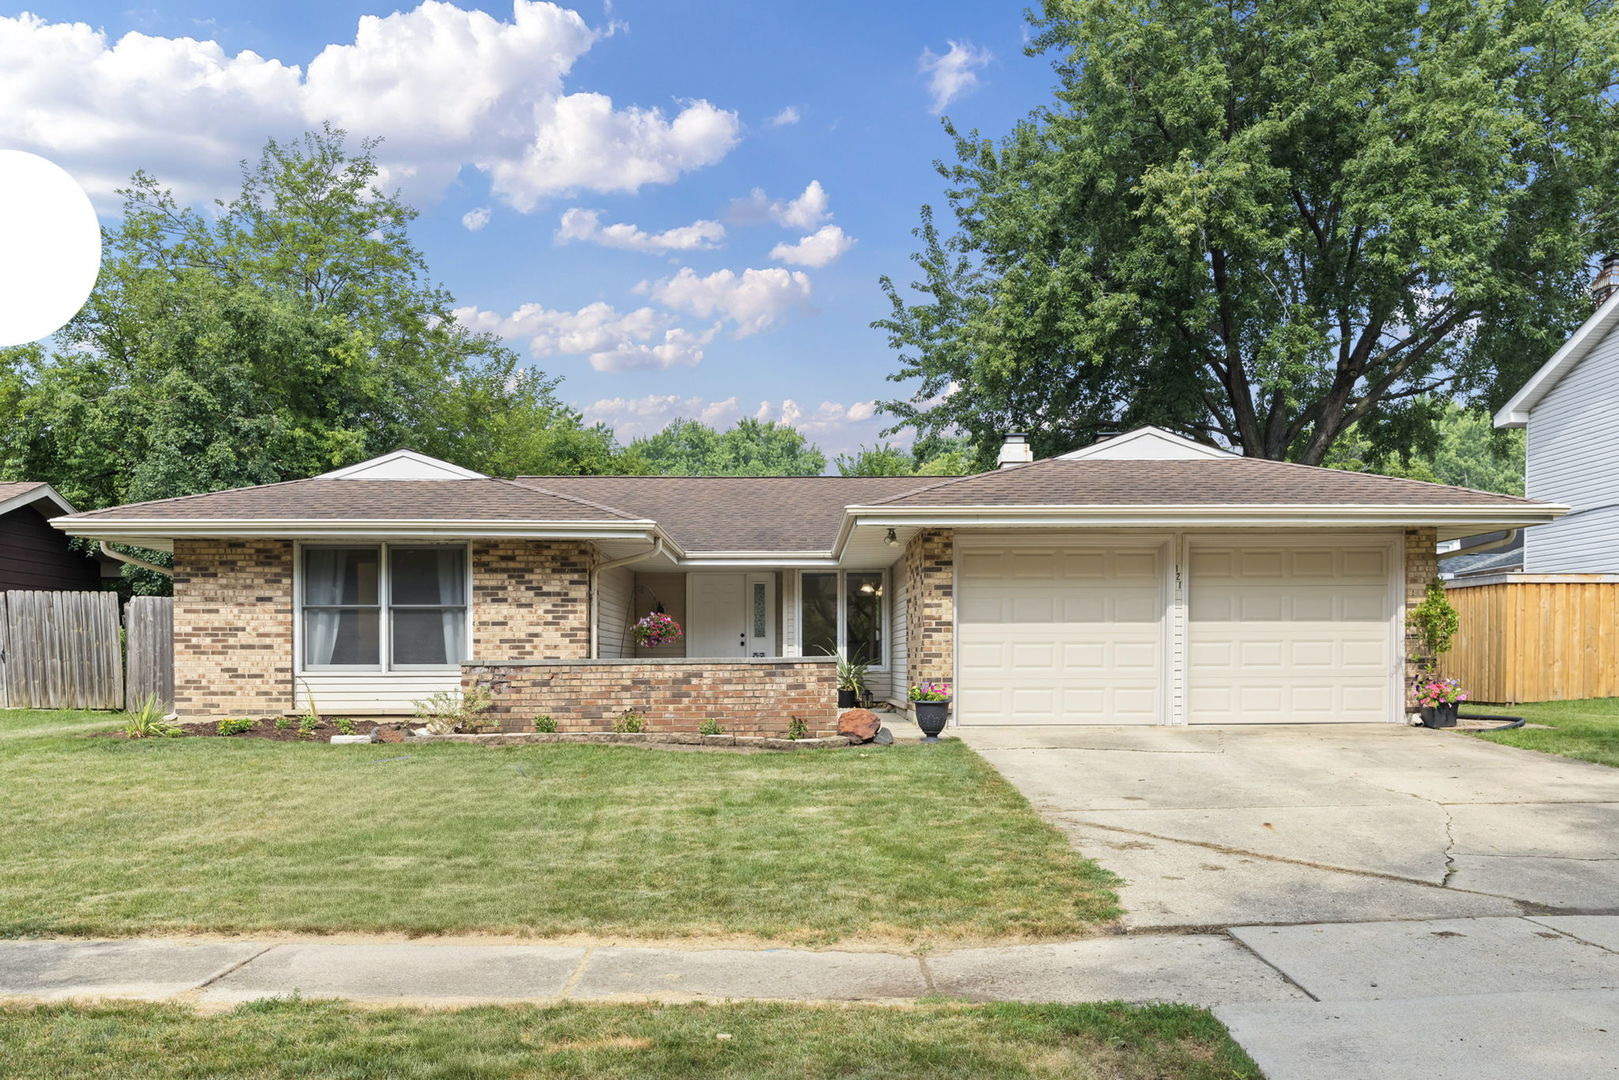
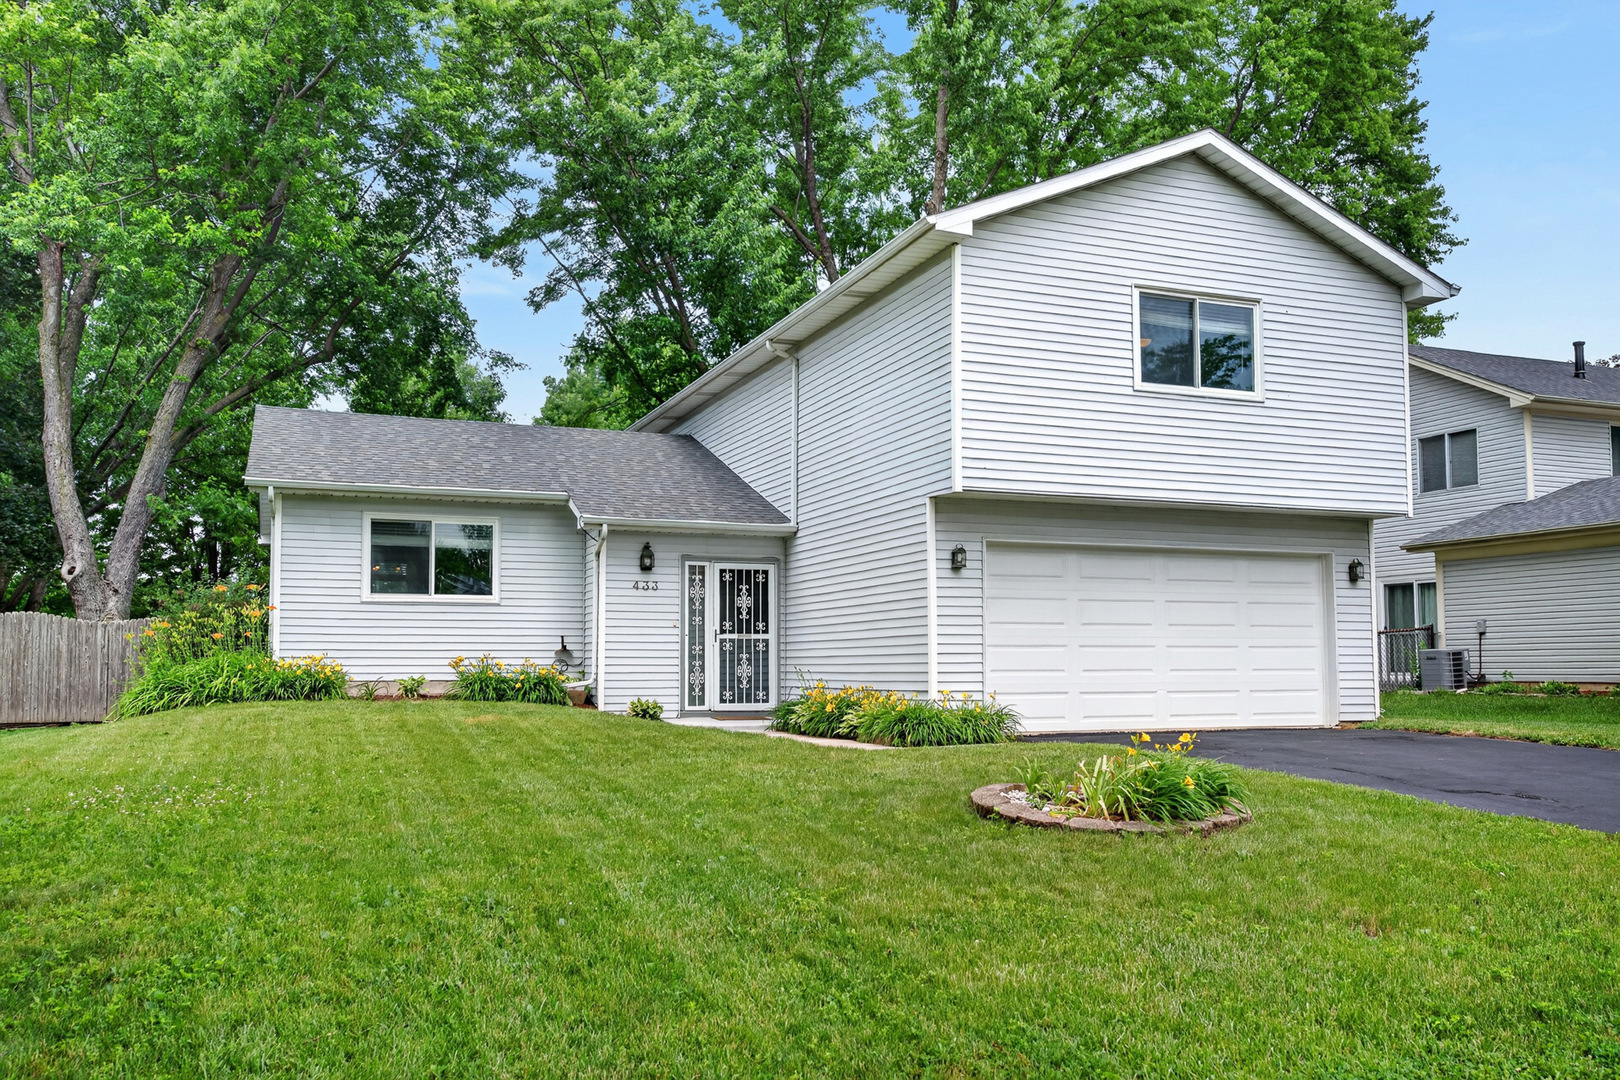
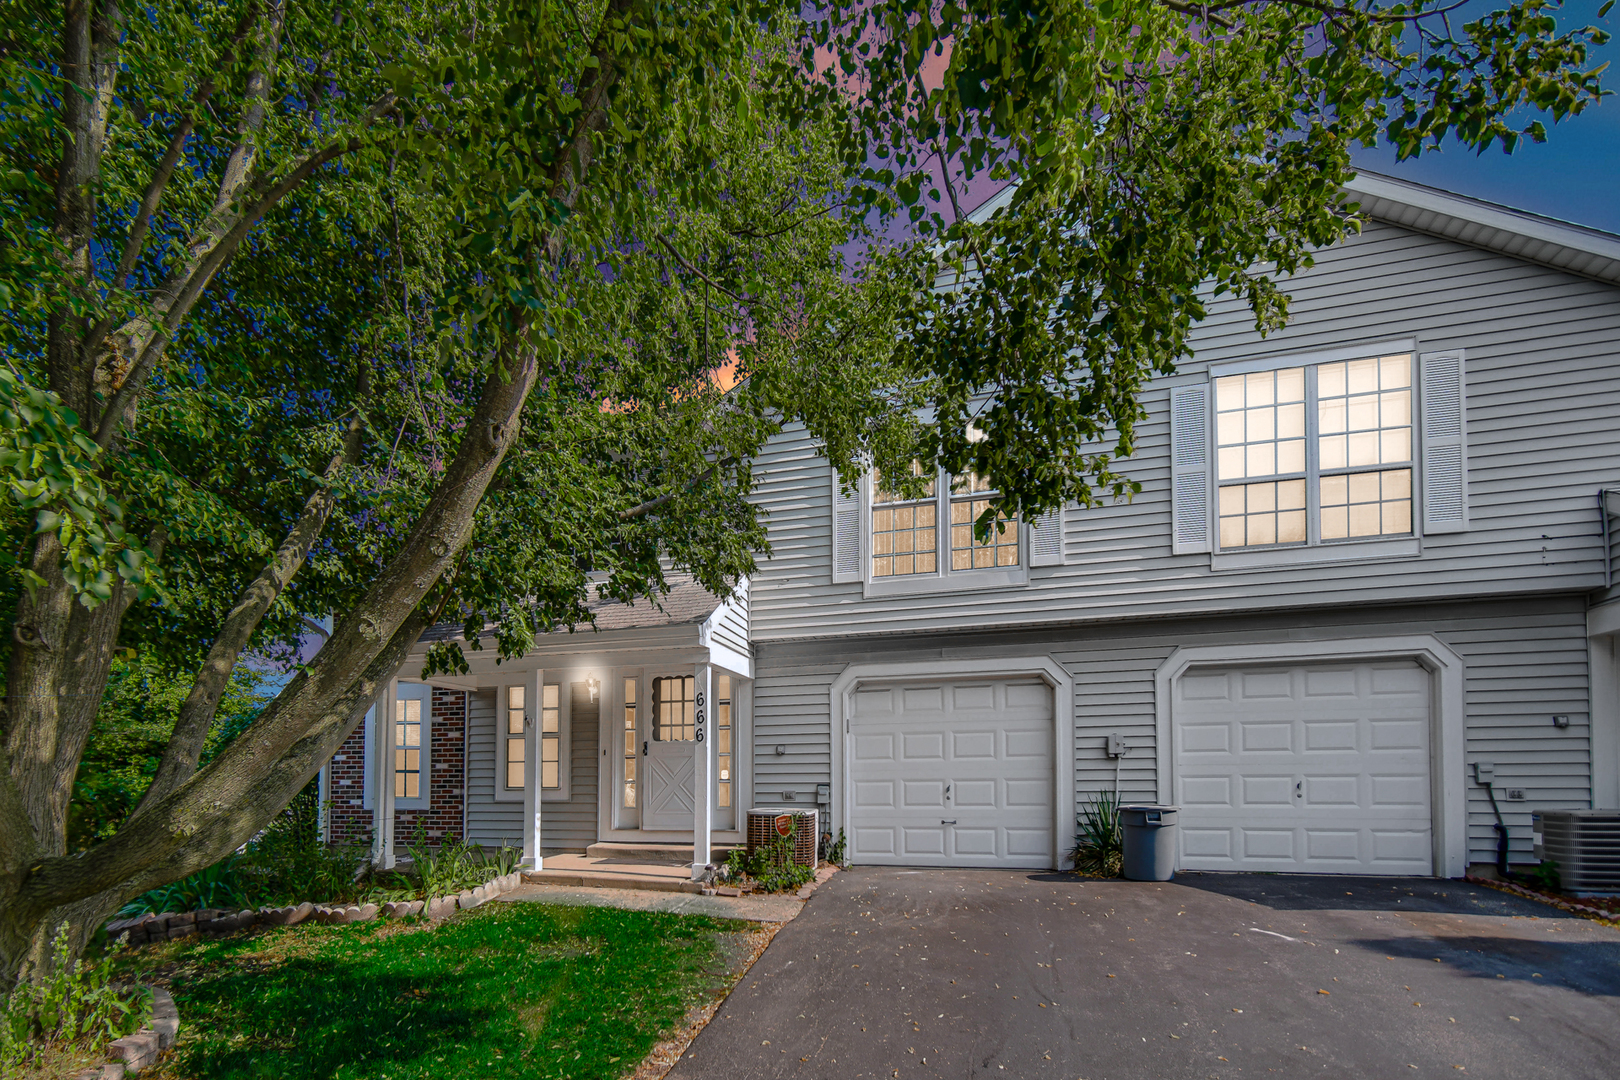
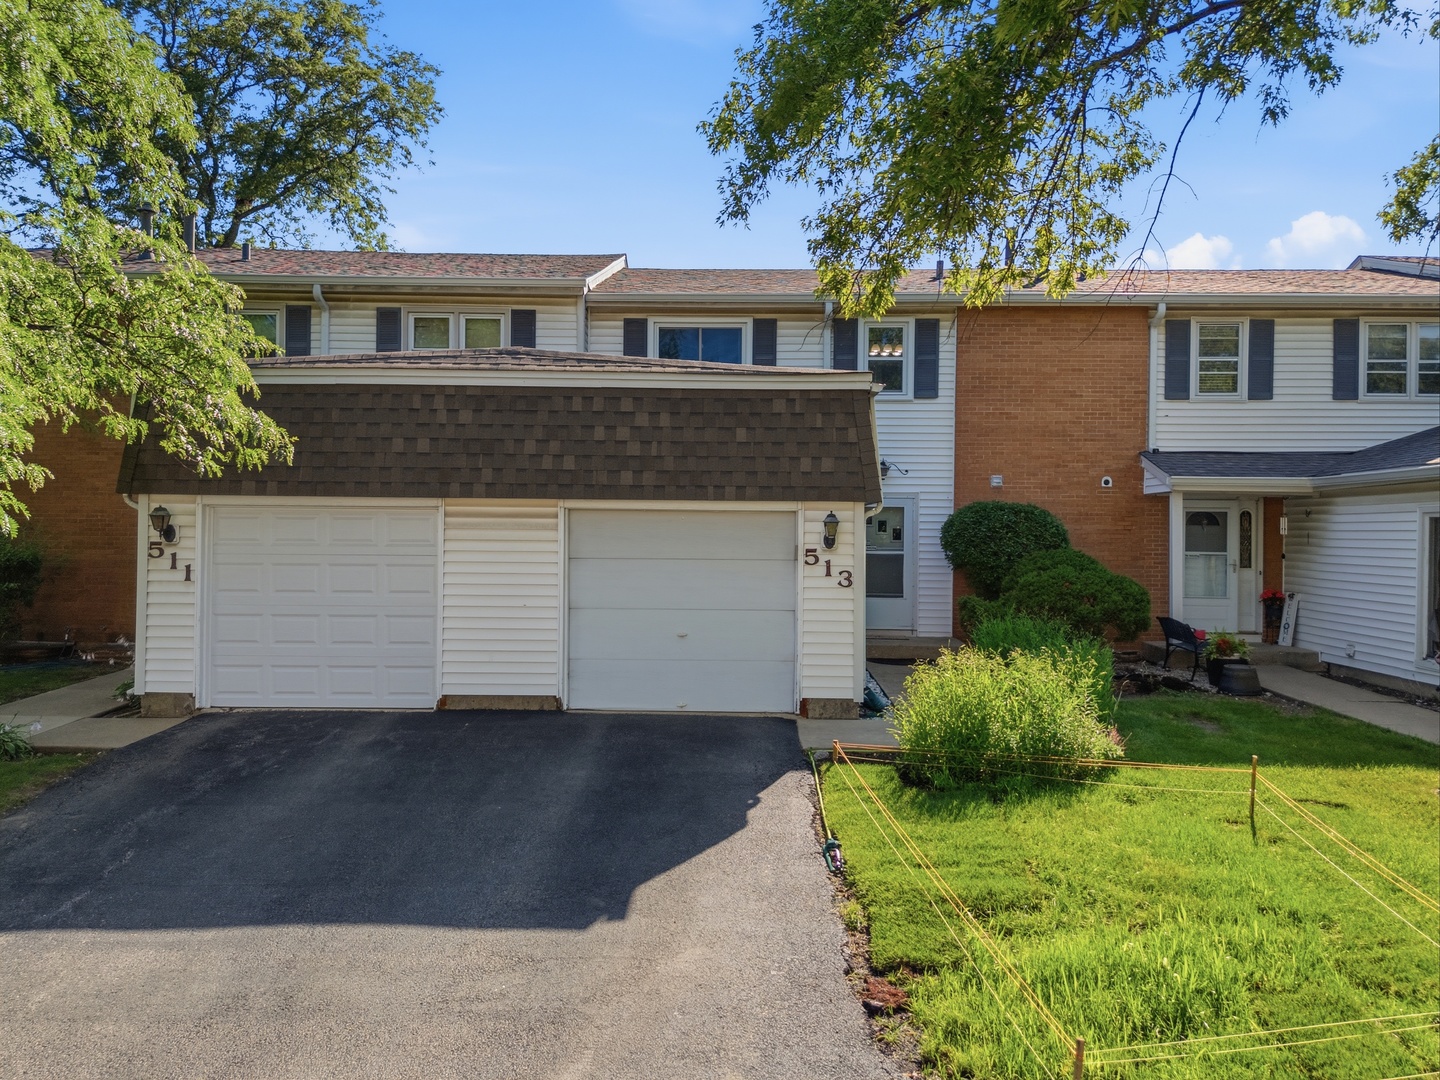
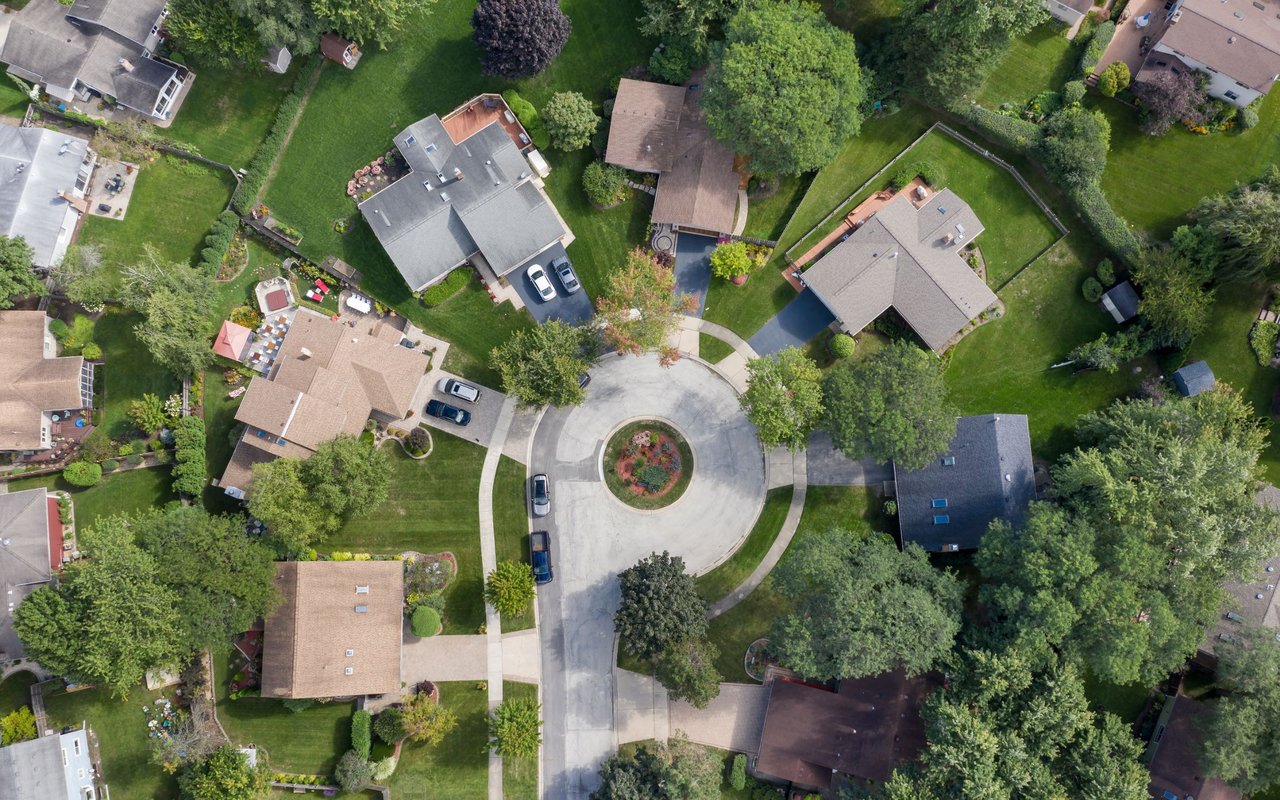
Neighborhoods & housing options
Bolingbrook offers a diverse housing stock that ranges from 1970s split-levels to massive contemporary builds and townhomes.
You’ll find:
-
Established areas like Indian Oaks and Brookwood Estates
-
Modern developments like Augusta Village and Heritage Creek
-
Luxury options near the Bolingbrook Golf Club and River Bend
Because the town spans such a wide area, you can find quiet, secluded cul-de-sacs or vibrant neighborhoods right next to the action. It is a fantastic market for those wanting more square footage for their dollar.
Schools in Bolingbrook
Bolingbrook is primarily served by Valley View School District 365U, though some portions fall into other districts like Plainfield 202.
See below for School Information and Ratings
Commuting from Bolingbrook
Bolingbrook is a commuter’s dream due to its "interchange" status.
-
I-55 provides a direct shot into downtown Chicago
-
I-355 connects you to the northern and western suburbs quickly
-
Pace Bus offers "Bus on Shoulder" express service to the city during rush hour
Parks, trails, and family stuff to do
The Bolingbrook Park District is widely considered one of the best in the state, offering high-end facilities usually reserved for private clubs.
Parks & Outdoor Space
-
Hidden Oaks Nature Center – Interactive exhibits, trails, and a connection to the Whalon Lake forest preserve
-
Bolingbrook Recreation & Aquatic Complex (BRAC) – A massive hub for fitness and family programs
-
Whalon Lake – Great for dog parks, kayaking, and scenic walking loops
Pools & Aquatic Centers
Golf Courses
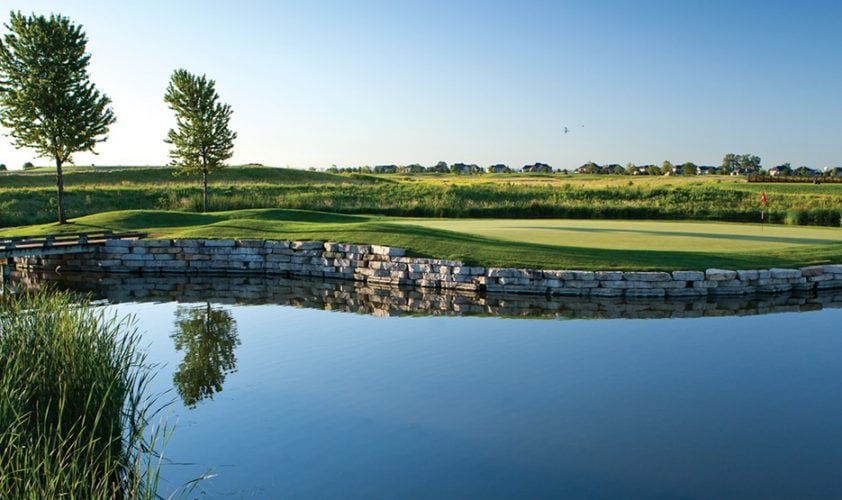
-
Bolingbrook Golf Club – An Arthur Hills-designed championship course with a 78,000 sq. ft. clubhouse
-
Boughton Ridge Golf Course – A 9-hole executive course perfect for a quick round
Diversity, community, and who Bolingbrook is best for
Bolingbrook is a community where everyone is welcome. It is officially one of the most diverse suburbs in Illinois, and that diversity is reflected in the local businesses, festivals, and neighborly feel.
Bolingbrook is usually a great fit for:
-
Families who want modern amenities and huge parks
-
Commuters who need fast access to both I-55 and I-355
-
Shopping and food lovers who want a "city-lite" retail experience
-
First-time buyers looking for value compared to Naperville or Downers Grove
Bolingbrook quick Q&A
Is Bolingbrook, IL a good place to live?
Yes, if you value convenience and modern lifestyle amenities. It offers a high quality of life with some of the best recreation facilities in the state.
Is Bolingbrook good for families?
Absolutely. Between Pelican Harbor, the nature centers, and the wide range of youth programs, it is built with families in mind.
How is the commute from Bolingbrook to Chicago?
While there is no Metra station directly in town, most commuters use the I-55 expressway or take a short drive to the Metra stations in Lisle or Downers Grove.
Next steps
If you’re considering Bolingbrook, start by deciding if you prefer the mature, established areas near the center of town or the newer, larger builds on the west side near the golf club.
Use the suburb guides on this site to compare Bolingbrook with nearby areas (Naperville, Romeoville, Plainfield, Woodridge), and if you want help finding the right pocket for your budget, reach out through the contact page to get a personalized short list.